Wednesday, January 27, 2021

Where Do Our Backyard Orioles Winter?

Baltimore Orioles are among our most identifiable and more popular songbirds, but where do they spend the winter months?
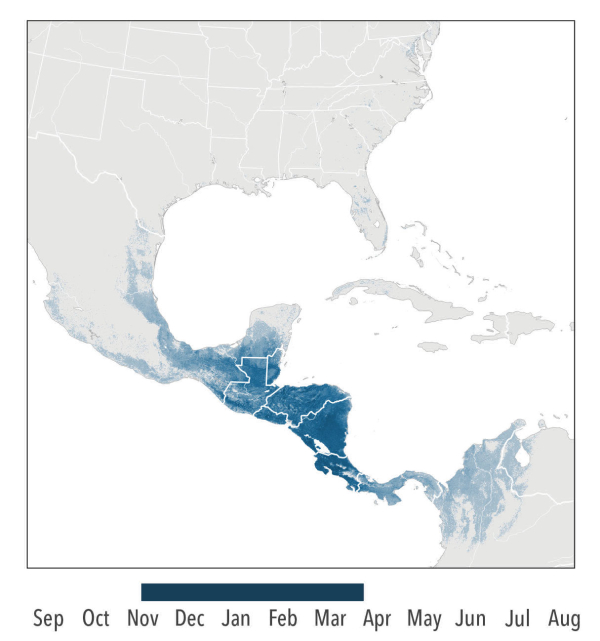
A single-week winter range map for Baltimore Orioles. The eBird Science maps are animated to show the annual movements and abundance of each species, which can be paused at week to week increments.
Western birders will appreciate learning about the movements and annual abundance of Bullock’s Orioles – and comparing that information to the other neotropical oriole ranges.
Where do fledgling Orchard Orioles spend the winter after they leave American feeding stations?

Orioles are some of the most popular songbirds that regularly visit feeders stocked with grape jelly and sugar-water nectar from late April through mid-September. Along with most warblers, tanagers, thrushes, and other neotropical migrants, orioles “disappear” from northern latitudes, leaving during late summer and early fall. But where do they go? Now, we have some remarkable new animated maps that provide a wealth of information about birds like our Baltimore Orioles, Bullock’s Orioles, and Orchard Orioles to show their respective nesting ranges, coupled with their migration routes to wintering areas – where they spend most of the year.

Produced by eBird Science, these animated “abundance maps” provide an amazing look at the distribution and relative abundance of each species, from their nesting range, south during their fall migration, wintering areas, and their spring migration north back to our states, provinces, and yards. To begin, click on the arrow in the middle of the map and the animation will begin. If you merely click anywhere on the map, you will stop the animation so you can take a closer look at a given date (week); click the map again to resume the animation.

These maps also show very informative and revealing ‘week to week’ oriole locations and movements. The maps can be stopped at weekly increments by using 2 arrow tabs at the lower right side of each map. By using the arrow tabs, you can view each species’ distribution week to week, which allows you to better see when migratory species pass through your state and local area – or when you can anticipate them during spring and fall. It is absolutely fascinating information provided in an impressive presentation, species by species.

Additionally, the movements illustrated on the maps are color-coded to provide insight about the abundance of the species in different portions of their distribution, even during migration – week by week, and throughout the year. To check on our most common backyard oriole species:

See the Baltimore Oriole abundance animation map at https://ebird.org/science/status-and-trends/balori/abundance-map-weekly

Review the Bullock’s Oriole abundance animation map at https://ebird.org/science/status-and-trends/bulori/abundance-map-weekly

Enjoy the Orchard Oriole abundance animation map at https://ebird.org/science/status-and-trends/orcori

For the record, you can check similar animated distribution and abundance maps for a variety of birds – those you may see in your yard, and many others that will interest you. You will surely enjoy learning about the impressive geography covered by many common birds, and you will be a better birder as a result of any self-instruction you undertake at https://ebird.org/science/status-and-trends/species

Article and photos by Paul Konrad

Share your backyard bird sightings and photos at editorstbw2@gmail.com